
Warning: This post contains math!
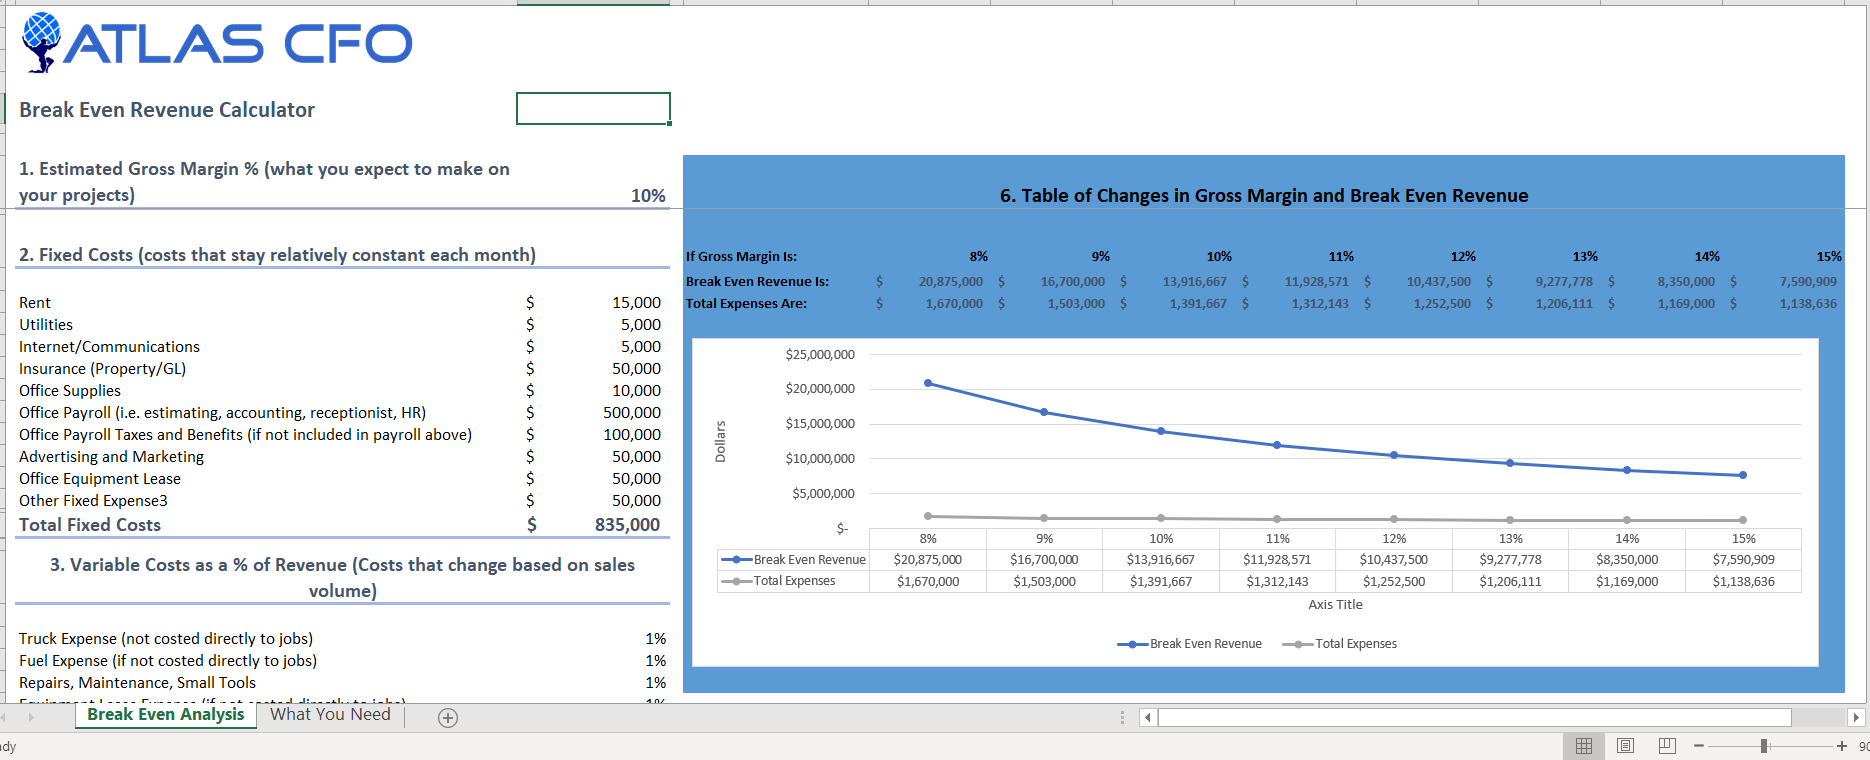
How much revenue do I need to break even?
This is one of the top 10 questions we get from business owners. (However, if you are one of our clients doing forecasting with Shane, you already know the answer. You know who you are. :-))
The follow up questions are:
How much do I need to bill each month?
How much do I need to bill each week?
How much do I need to bill each day?
My answer: It depends.
Don’t you love it when someone gives you that answer?!?! Not helpful!
Well, I want to be helpful, so it depends on:
Overhead expense budget
Do you have an overhead budget established for the year? If so, we have a good place to start. If you don’t and would like some tips and a template, check out our blog/video on Why Bother With Budgets.
Gross margin
What is your average gross margin? Most of our contractors can answer this question quickly. If you can’t, it is time to do some investigating. There are a couple of places to look:
- Income Statement/Profit and Loss Statement
- Average markup on jobs in the estimate
- Margin expectation based on historical performance
In this industry and depending on how you organize your costs, gross margin can range from 5-35%. This is quite a large range, but it is the truth. Net income from contractor to contractor is more consistent, but gross margin varies widely. This one item alone makes “It depends” a pretty accurate answer! Why? Because some people have only fixed costs in overhead. Others include variable costs. Some contractors put all of their variable costs in their jobs. Others put some in the job. Knowing your gross margin and overhead split determines how to calculate your break-even.
A Simple Example
So to make it easy for the sake of this discussion, I’m going to assume that you have 2 major categories of expense:
- Direct costs – all things job costed that gets you to gross margin. In other words what it costs to put the work in or keep the workers working.
- Overhead budget – everything else on the Income Statement that is not directly related to performing the work.
This is an example, simple Income Statement for our calculations:
Revenue XX,XXX,XXX
Direct Costs -XX,XXX,XXX
Gross margin X,XXX,XXX
Overhead -X,XXX,XXX
Net income XXX,XXX
Now let’s do a break-even calculation together:
Assume Contractor A has $1,000,000 in expected overhead expenses for the upcoming year
Assume Contractor A has a gross margin of 20%
The calculation would look like this:
$1,000,000/.2 = Break-even sales of $5,000,000
We can then show an example expected income statement:
Revenue $5,000,000 (break-even revenue per calculation)
Direct Costs -4,000,000
Gross margin 1,000,000 (20% margin)
Overhead -1,000,000 (expected overhead)
Net income $0
We can then break this out by month, week or day to get to the minimum sales needed to break-even. Now you know if you did better than the minimum sales one day, week or month, you are getting ahead. Likewise, if you did worse you can estimate how much you need to make up to get back to break-even.
You now have some important insight into your operations:
- Your expected gross margin
- Your expected overhead
- Revenue needed to cover your expenses
So, what happens next?
Some contractors find that calculating break-even revenue gives them enough direction to move forward for the year. Others have additional goals and/or questions to address to provide direction to their year. (We use our proprietary forecast tool called our Atlas Growth Model to in cases where our clients want more analysis.) Our next post will go deeper into the additional analysis that can be done AFTER your break-even calculation.
If you’d like to learn more about the Atlas Growth Model (which basically tells you the financial future of your business!) then go here.